Back to the BIM & IFC blog
Tools & comparisons · 2026-10-10 · 12 min
Rain-Flood Simulation on an IFC Model, in the Browser: a Setup Guide
Where does the water go in a cloudburst, and does it reach the doors? A georeferenced IFC, the ground under it and the streets around it are enough for a first answer, in the browser, in under a minute. How to set the simulation up so the answer is worth something, and how to read it.
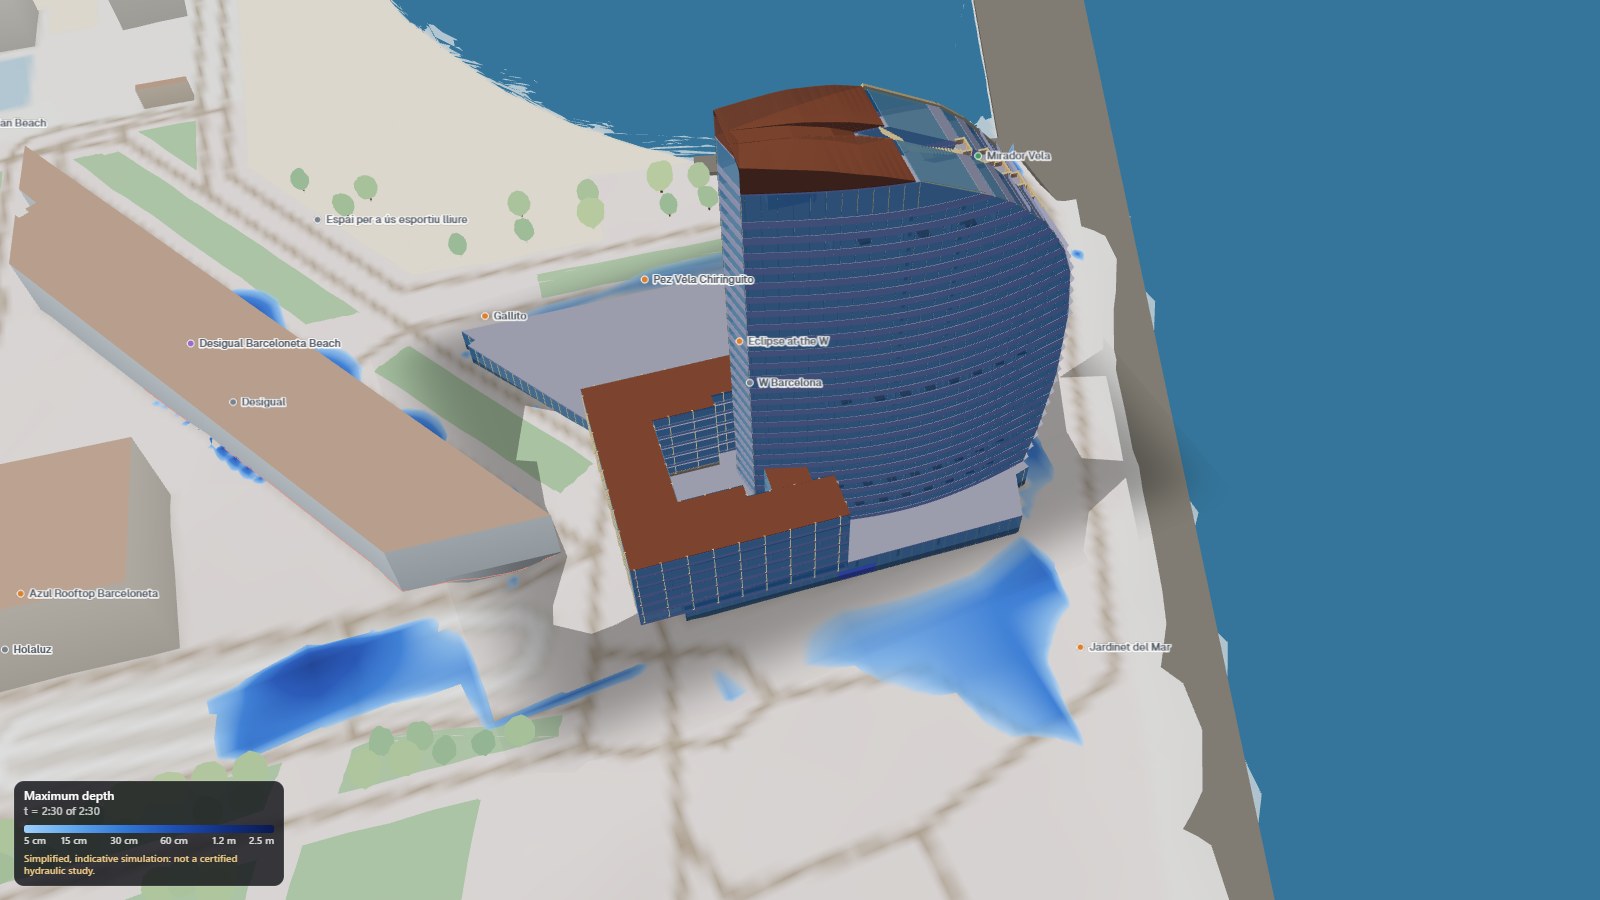
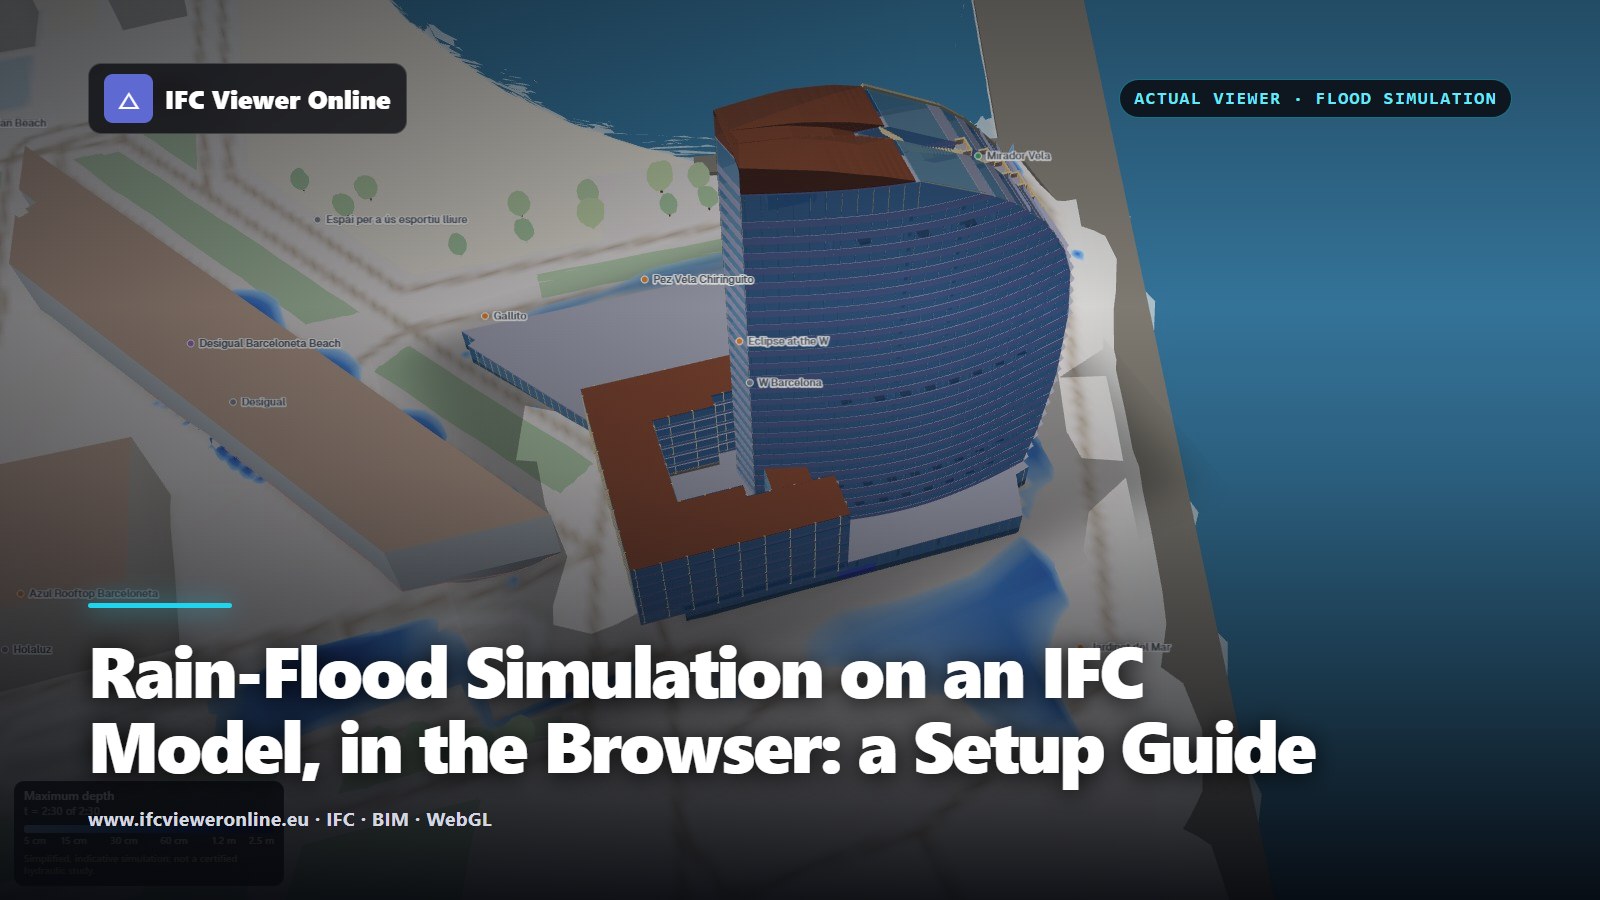 Rain-flood simulation in IFC Viewer Online: the W Barcelona hotel IFC on the 3D map of Barceloneta, with the maximum water depth of an extreme storm in blue around it
"If 120 mm falls in two hours, where does the water go, and does it reach the doors?" The question comes up at design reviews, in planning conversations, and every time a storm floods a street nearby. The usual answer is a hydraulic consultant, or no answer at all until much later in the project.
A georeferenced IFC already carries most of what a first answer needs: where the building stands, its footprint and its ground floor. Add the ground under it and the streets around it, and a 2-D rain-flood simulation can show where surface water runs and collects, how deep and how fast, in the browser, in seconds. It is indicative, not a certified study, and this guide is about setting it up so that the indication is worth having.
Key takeaways
- A flood simulation is only as good as its ground. Use the map's relief or a DEM, and read the "What the simulation sees" report before trusting a single number.
- Cell size is a question of scale: 1 m for doors and kerbs, 2 m for a block, 5 m for a neighbourhood.
- Keep the OpenStreetMap neighbourhood on. Sealed streets, parks that absorb, walls, the buildings next door and the rivers that are gone all change where the water goes.
- The result is maximum depth, speed and arrival time, plus the doors, spaces and equipment below the water next to them, exportable as GeoTIFF for GIS.
- It answers "where does surface water collect?", not "is this compliant?". No sewer network, and rivers rising are not an input yet.
Try it: an extreme storm on the Hotel Vela
Loads the W Barcelona hotel's IFC on the Catalan cartographic institute's terrain, with its neighbourhood from OpenStreetMap, and runs 120 mm of rain in two hours on your graphics card. The map asks for your consent before it contacts its providers.
Open the interactive IFC viewer
What it simulates, and what it does not
Rain falls on every cell of a regular grid laid over the model and its surroundings. The water then moves by the 2-D shallow-water equations in their local-inertial form[bates2010], with the flux weighting of de Almeida and colleagues[dealmeida2012]. It runs downhill, pools in low spots, goes round walls, and leaves at the edges if you let it. Roofs hand their rain to the street at their foot, and the ground absorbs according to its soil and cover.
It all runs on your graphics card, with WebGPU or, where that is not available, WebGL2. The GPU result is checked against a CPU reference: the same number of time steps and the same water to six decimal places. The volume is accounted for at every step, and the panel shows the mass balance error, typically around one part in a million.
What it does not simulate:
- The sewer network. Gullies and pipes are not modelled. Roofs can be sent "to the sewer", and courtyards walled in by buildings are taken as drained, but the water on the street stays on the street.
- Rivers and the sea. The input is rain. A river rising or a storm surge is not an input yet.
- Doors and windows as openings. Buildings are solid; the simulation reports the water standing outside each element, not whether it gets in.
- Wind, waves, sediment and floating debris.
Set it up, step by step
- Open a georeferenced model Drag your IFC into the viewer. If it states where it is (IfcMapConversion), the terrain and the streets come from the right place. If it does not, place it on the map by hand first.
Federated sets: load the structural model with the architecture. An architecture model without its slabs and basement walls reads its ground floor as raised, and the panel warns that water would run underneath it.
- Turn on the map, with relief Map → Show on map → Terrain. The first time, the map asks for your consent to contact its providers. In Catalonia the relief is the ICGC's 5 m bare-earth model; elsewhere, a global mosaic of about 30 m.
A 30 m relief does not see kerbs or a sunken driveway. For a real site, import a DEM (.asc or GeoTIFF) in the panel.
- Open Flood From the tool rail, or Tools → Flood.
- Choose the grid A cell of 1, 2 or 5 m, and a margin around the model (60 m by default).
- Check the ground and the buildings Keep "Use the map's relief", "Map buildings are obstacles" and "Neighbourhood from OpenStreetMap" on. Roofs drain to the street, unless you know their downpipes go to the sewer.
- Pick a storm Four presets, from 10 mm in 30 minutes to 120 mm in 2 hours, or Edit to draw your own rainfall, five minutes at a time. Then set how long to keep simulating after the rain stops.
- Set the surface and the soil Roughness, from paved to dense vegetation, and soil, from impervious to sandy. With the OpenStreetMap neighbourhood on, streets, parks and woods set their own values cell by cell.
- Choose the edges "Water leaves" lets it flow out of the area. "Closed" keeps every drop in: the worst case, and the right one for a basin with no outlet.
- Build the grid, then read what it sees Build the grid, then check the report before you run anything (next section).
- Simulate A two-hour storm on a grid of 100 × 100 cells takes a few seconds, even on an integrated graphics chip.
 The panel, top to bottom, in the order the decisions are made. Here: 1 m cells, the map's relief, the OpenStreetMap neighbourhood, the extreme preset and closed edges.
Settings that change the answer
| Setting | Options | When it matters |
|---|
| Cell | 1 · 2 · 5 m | The smallest thing that changes the flow must be at least one cell wide: a 15 cm kerb on 5 m cells does not exist. Halving the cell makes four times as many cells. |
| Ground | IFC terrain › DEM › map relief › filled › plane | The first source that answers wins. The demo plane is a placeholder: results on it say little about the site. |
| Stand the ground on the ground floor | On · off | When the IFC's stated height and the terrain disagree by more than 0.5 m. Off, a model floating 2 m above the ground never gets wet; a buried one is flooded from the start. |
| OpenStreetMap neighbourhood | On · off | Streets are sealed, parks absorb, walls and the buildings next door block, old rivers are marked. Off, everything outside the model is one uniform surface. |
| Roofs | To the street · to the sewer | A large roof's rain lands at its foot. If its downpipes go to the sewer, the street gets none of it. |
| Storm | Presets · drawn by hand | Both the total and the peak matter: 60 mm in 45 minutes peaks at 160 mm/h, 120 mm in 2 hours at 120 mm/h. |
| Soil | Impervious · compacted · loam · sandy | Horton infiltration: fast at first, slowing as the soil wets. Sandy soil takes 125 mm/h at first and 25 mm/h later; compacted soil 25, then 3. |
| Edges | Water leaves · closed | Closed is the worst case: every drop stays, and the water ponds against the lowest edge. |
 Three sources, in order of trust, make one grid for the solver.
Before you trust it: what the simulation sees
After Build the grid, the panel lists what went into it. Two minutes reading this report saves an afternoon of wrong conclusions.
 Torre Poblenou, Barcelona: the ICGC 5 m relief, 93 streets, 3 old or buried watercourses and 36 buildings from OpenStreetMap, and a model stated 1.8 m above the ground around it, so the ground was stood on its ground floor.
- Ground: "Map relief" or "Imported DEM". "Plane" means the result is about a flat demo surface, not about your site.
- Coarse relief: outside Catalonia the map's relief is about 30 m data. It does not see streets, so import a DEM for anything detailed.
- A height mismatch: the model's stated height against the ground around it. Worth fixing in the IFC (IfcMapConversion.OrthogonalHeight).
- More canopies than walls: usually an architecture model loaded without its structure.
- Courtyards: taken as drained by their own gullies, so they receive no roof rain.
- OpenStreetMap unavailable or partial: the neighbourhood came from the map's tiles, without watercourses or walls, or was cut short by the element limit. Rebuild asks again.
Reading the result
Three views colour the water: Depth now, Maximum depth (the highest it reached anywhere during the event) and Speed. Flow lines show which way it moves. "Show from" hides water shallower than a threshold, 5 cm by default, so a wet pavement does not read as a flood.
Hotel Vela, Barcelona, 2 m cells, the extreme storm, water free to leave: 6,772 m² under water at the peak, 55 minutes in. The deepest spots, over a metre, are low points at the foot of the neighbouring building: the places to look at on site.
The timeline along the bottom replays the event at 1, 5 or 20 simulated minutes per second, with the rain above and the flooded area below. Probe reads a single point: depth and speed at that instant, the deepest it got, when the water arrived, and a curve of depth over the whole event.
 Speed at the peak, 55 minutes in, with flow lines. Fast water is more dangerous than its depth suggests.
The doors, spaces and equipment the water reaches
When the run ends, the viewer checks the model's doors, windows, accesses (ramps, stairs, lifts), spaces and equipment against the highest water next to each of them, and lists the ones below it, with the depth and the time the water arrived. The list appears in the flood panel and as a group in the Validation panel. It is not part of the validation result or the Health Score.
 Poblenou, 1 m cells, the extreme storm with closed edges: one of the nine elements checked lies below the water next to it.
Elements whose lowest point is under the ground outside (basements, sunken accesses) are listed apart, as below ground. For them the figure is the water standing outside: whether it gets in depends on openings the simulation does not model. On the Hotel Vela, 309 elements were checked and three were reported, all below ground: two basement zones and the ground-floor lobby.
With the OpenStreetMap neighbourhood on, the buildings next door the water reaches are listed too, deepest first and named where OpenStreetMap names them, and outlined on the map from amber to red. A click flies to each.
Export it
- An image (PNG) with the legend, the instant and the "indicative" note painted in.
- A video of the whole event, about 16 seconds, with the same legend in every frame.
- GIS files of the whole grid: maximum depth, maximum speed and arrival time, as GeoTIFF, ESRI ASCII grid or a CSV of the wet cells. North up, in the model's coordinate system when it is georeferenced (for example EPSG:25831), with buildings as no-data. They open in QGIS or ArcGIS as they are.
How fast it runs
Simulated time per second of computing
- 250 × 250 cells (2 m: 500 × 500 m): 1550×
- 500 × 500 cells (2 m: 1 × 1 km): 665×
- 1000 × 1000 cells (2 m: 2 × 2 km): 210×
WebGPU on an integrated graphics chip (AMD Radeon Vega, Ryzen 5 5600H), Chrome, city test case at 2 m. Deep water slows it down: at 1 m deep, expect about half.
The Hotel Vela run above, 130 × 114 cells, ran at about 690 times real time on WebGL2: the two-and-a-half-hour event in about 13 seconds.
What leaves your browser
Nothing about the model. The simulation reads what is already loaded and keeps its results on your device. With the map on, its tiles, the relief and the OpenStreetMap neighbourhood come from public providers, which see the area and your IP address, as with any web map. The map asks for your consent before its first request, and Map → Data and permission withdraws it. The relief in these examples is the ICGC's[icgc-met], the neighbourhood is OpenStreetMap's.
Before you share a flood result
- The ground is real: the map's relief or a DEM, not the demo plane.
- Any height mismatch between the IFC and the terrain is understood, and fixed in the IFC if the IFC is wrong.
- The structure is loaded with the architecture, so ground floors read as walls, not canopies.
- The cell is fine enough for what you are looking at: doors and kerbs need 1 m.
- The storm is stated by its numbers (total, duration, peak), not as "a 100-year storm". — A return period belongs to a place. Only that place's rainfall statistics turn one into millimetres.
- The image or video carries the legend and the "indicative" note. Exports do by default.
Near a river that was buried under the streets? The simulation marks old and piped watercourses from OpenStreetMap and measures the water over them. That is in buried rivers and flood risk. To put the model on the map in the first place, see how to view an IFC on a 3D map.
Rain-Flood Simulation on an IFC Model, in the Browser: a Setup Guide