Back to the BIM & IFC blog
Digital twins · 2026-10-10 · 9 min
Live Buses on an IFC Model: a Bus Terminal Digital Twin Over MQTT
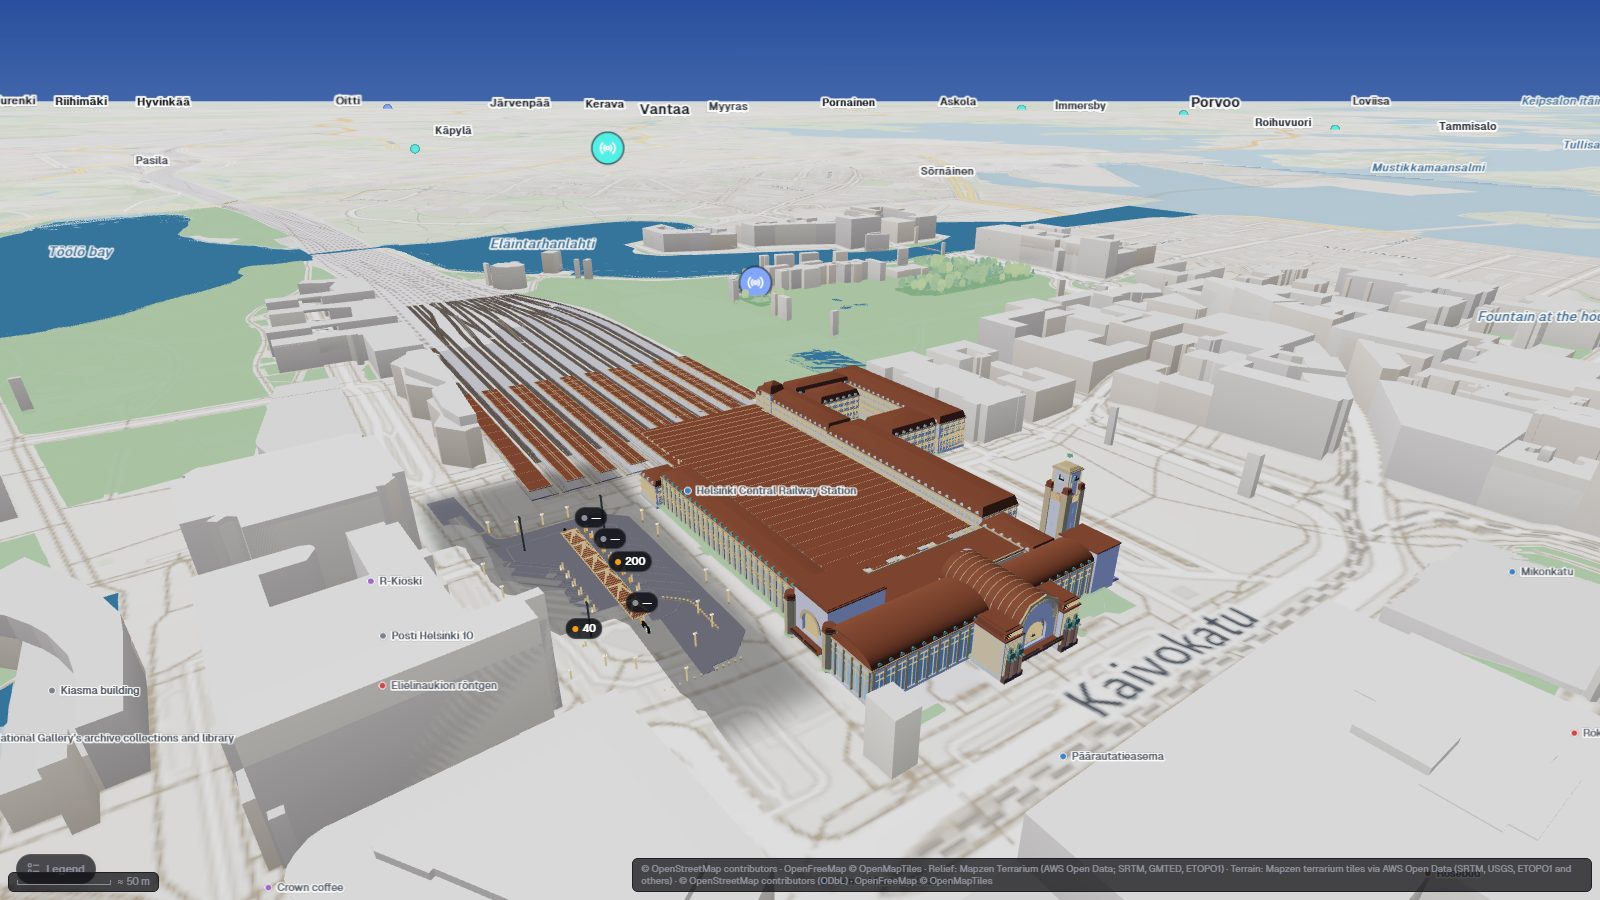
At the Elielinaukio terminal next to Helsinki Central Station, each bay of an IFC model lights up when a real bus stands at it, with the line number above. The data comes from HSL's public MQTT feed, received directly by the browser.
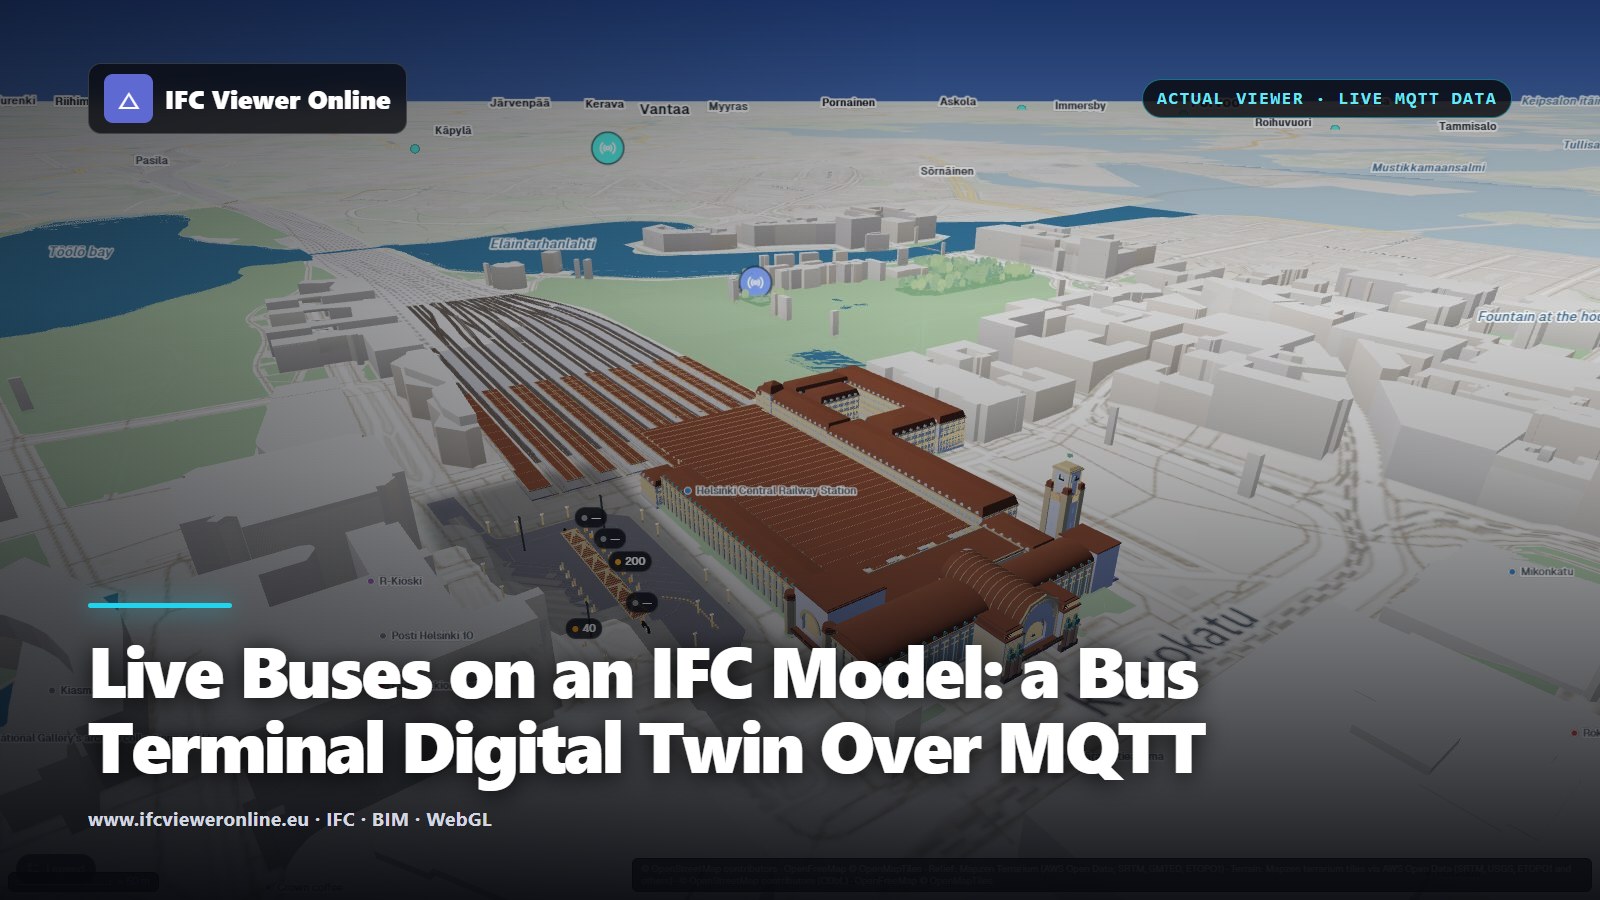 Helsinki Central Station and the Elielinaukio bus terminal as IFC models on the 3D map, with live bus line numbers floating over the bays
A bus terminal is a good test for a digital twin, because what it is doing changes by the minute. Seventeen bays, buses pulling in and out, doors opening and closing. If the model can show that live, from public data, it can show most things.
This scene does it for Elielinaukio, the terminal on the west side of Helsinki Central Station. Each bay of the IFC model lights up while a real bus stands at it, with its line number floating above. The positions come from HSL, Helsinki's transport authority, which publishes every vehicle's position about once a second over MQTT, and the browser subscribes to it directly.
Key takeaways
- MQTT over WebSocket lets a web page receive live vehicle positions with no server of its own in between, as long as the broker allows it. HSL's does.
- Subscribe narrowly. A geographic slice of the topic tree means only the terminal's buses reach the browser.
- Bays are bound to the transit agency's stop ids, and the colours follow rules on fields in the message: doors open, standing, moving, or no bus.
- Federated models stay aligned when each satellite is turned to its own georeference. Here the Cathedral's frame is 3° off the terminal's.
Try it: Helsinki's buses, now
Opens the terminal, the station and the Cathedral on the map. Bays light up as real buses arrive. At night there are few, so the bays stay grey for long stretches.
Open the interactive IFC viewer
What you are looking at
Three georeferenced IFC models (ETRS89 / GK25, EPSG:3879) on the OpenStreetMap city: Eliel Saarinen's Central Station with its platforms, the Cathedral on Senate Square, and the bus terminal with its 17 bays (20 to 36), poles, signs and canopy. Two live layers from the Finnish Meteorological Institute show air quality and weather.
 The bays as the buses come and go: each pole and sign takes the colour of what the bus at that stop is doing.
| Bay colour | Rule on the HSL message | Meaning |
|---|
| Green | doors open (drst = 1) | Boarding |
| Blue | speed under 0.5 m/s | Standing at the bay |
| Amber | any other reading at the stop | Pulling in or out |
| Grey | no reading for 45 s | No bus |
The first rule that matches wins. The line number (desi) floats above the bay.Why MQTT, and not GTFS-Realtime
GTFS-Realtime is the usual format for live transit data, and HSL publishes it. But that feed does not send the CORS headers a browser needs to read it from another site, so using it would mean running a proxy. The high-frequency positioning feed is different: it is MQTT over WebSocket, public, keyless, and reachable from any web page.
It is also richer for this purpose. Each message is one bus, about once a second, with its line, speed, door state and the stop it is at[hfp]. The topic says where the bus is, so a subscription can be cut to one slice of the city:
/hfp/v2/journey/ongoing/vp/bus/+/+/+/+/+/+/+/+/60;24/19/73/#
 The subscription level by level: each + takes any value, and the geohash narrows the stream to the cell around the terminal.
The last part, 60;24/19/73, is a cell of HSL's geographic grid around the terminal. The browser receives the buses in that cell and nothing else. It reads the messages once a second and keeps the newest one per stop. A bus between stops, with no stop in its message, is skipped.
From a stop id to a bay
HSL identifies stops by number, the IFC model by name. HSL's published stop list joins the two: nine of the seventeen bays have an HSL stop today, and each of them is one binding. The elements are found by name, "Bay 20" and so on. That finds the pole and the three signs of each bay.
| Bay | HSL stop id |
|---|
| 20 | 1020128 |
| 22 | 1020131 |
| 23 | 1020133 |
| 24 | 1020135 |
| 25 | 1020132 |
| 26 | 1020239 |
| 28 | 1020243 |
| 29 | 1020245 |
| 30 | 1020130 |
From HSL's GTFS stops list, read once when the scene was written. The other eight bays have no stop and stay grey. A bay's card at night: with no bus at the bay, the live section says so instead of showing an old reading, next to the IFC data of the pole.
{
  "id": "hsl-hfp-elielinaukio",
  "url": "wss://mqtt.hsl.fi:443/",
  "topics": ["/hfp/v2/journey/ongoing/vp/bus/+/+/+/+/+/+/+/+/60;24/19/73/#"],
  "mapping": { "idField": "VP.stop", "timeField": "VP.tst" }
}
This device source is all it takes to read a different fleet or a different area: a broker that speaks MQTT over WebSocket, the topics, and which field of the message identifies the device. The rest of the scene stays the same.
Air quality and weather
The two map layers come from the Finnish Meteorological Institute's open data[fmi], read in the browser as simple WFS features: 11 air-quality stations and 7 weather stations around the city when we checked. Air quality is hourly and can arrive up to 40 minutes late; weather every 10 minutes.
Three models, one map
The station, the Cathedral and the terminal are separate files, and each one carries its own georeference. The Cathedral's local axes are turned 3° from the terminal's, which anchors the map. If the viewer only moved the other models into place without turning them, the Cathedral would stand 3° askew, about 2 m off at its corners.
The viewer turns each model to its own frame, about its own centre. Measured against the OpenStreetMap outline of the Cathedral, the walls now sit 0.56 m from it and 0.37° off. That remainder is how accurately the model and OSM each draw the building.
Limits worth saying out loud
- The models are illustrative, drawn from public sources. They are not surveys.
- Only nine bays have an HSL stop, so the other eight never light up.
- At night few buses run, and the bays stay grey for long stretches.
- The global terrain here reads about 18 m above the Finnish height system, so the models stand on the terrain's surface rather than at their stated heights. Their heights relative to each other are kept.
- A background tab receives messages less often, because browsers slow down timers in hidden tabs.
The same scene format runs a city square from bike-share and charging data in the Barcelona open-data twin, and two Tokyo stations from train and tram data in Tokyo transit twins from ODPT. For a twin fed by a sensor rather than a transit feed, see real-time LiDAR in a web digital twin.
References
- High-frequency positioning — Digitransit (HSL). The MQTT topics and message fields used by the terminal.
- Open data — Finnish Meteorological Institute. Air-quality and weather observations, read here as simple WFS features.
Live Buses on an IFC Model: a Bus Terminal Digital Twin Over MQTT