Back to the BIM & IFC blog
Digital twins · 2026-10-10 · 9 min
A Live Digital Twin of Plaça de Catalunya, Built From Open Data in the Browser
Eight IFC models of Plaça de Catalunya on the real terrain, with Bicing docks, an EV charger, street traffic and air quality updating from Barcelona's open data. It all runs in the visitor's browser: no IoT platform, no GIS server, no backend of ours.
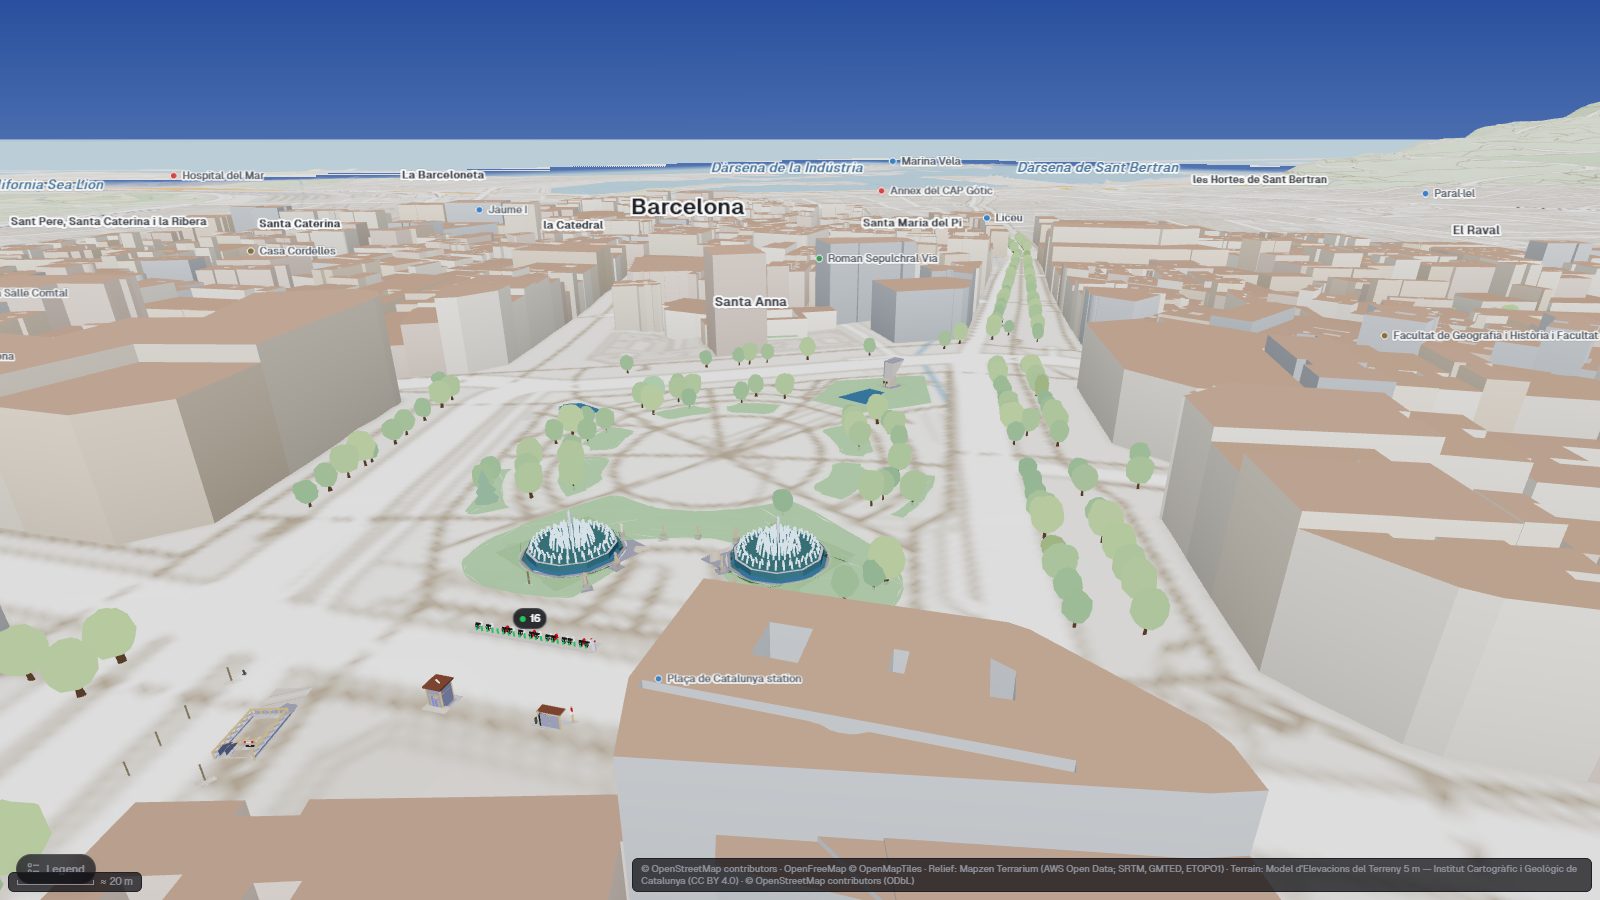
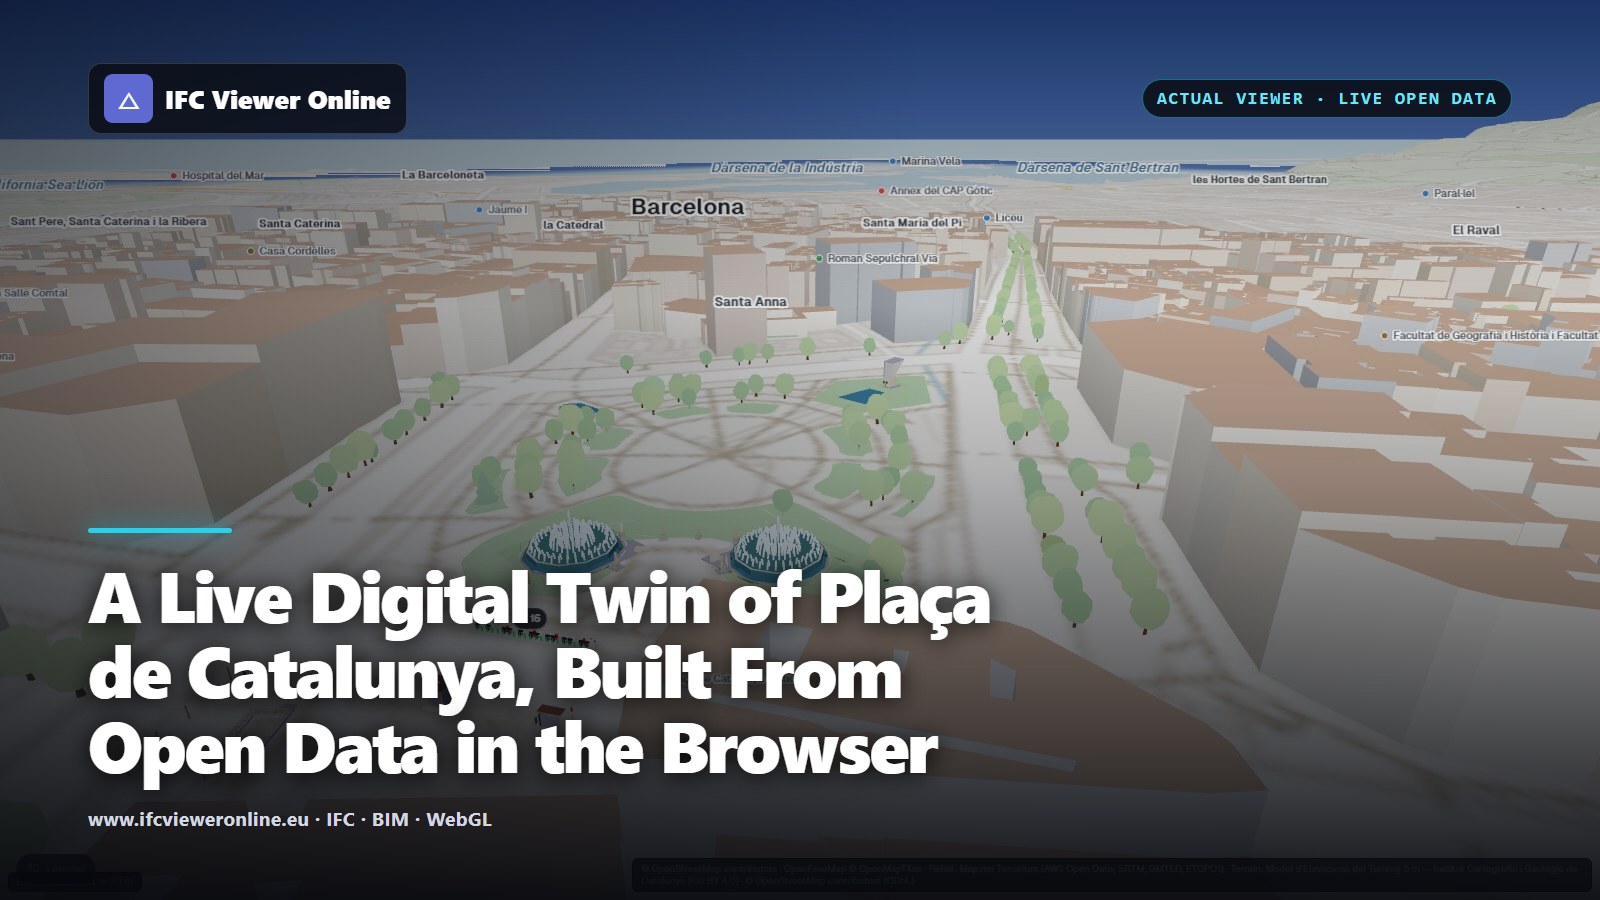 Plaça de Catalunya in IFC Viewer Online: the twin fountains and other IFC models on the 3D map of Barcelona, with a live Bicing count floating over the docks
Most digital-twin demos start with a platform: a cloud account, a connector licence and a server for the sensors to talk to. This one starts with a link. Open it, and eight IFC models of Plaça de Catalunya stand on the real terrain of Barcelona while the city's public feeds paint them: a bike-share station's docks, an EV charger's bays, the traffic on the streets around, and the air quality.
Nothing in between is ours. The visitor's browser fetches the models from this site and the data straight from each provider. That puts limits on what the twin can do, and they are covered below. It also means anyone can open it, embed it, or copy its scene file and build their own.
Key takeaways
- A useful digital twin can be built from open data alone when the providers allow browser requests (CORS). Barcelona's Bicing, Endolla, traffic and air-quality feeds all do.
- The link between data and model is a binding: a feed, a device id, a query for IFC elements by class and name, and colour rules where the first match wins.
- Alignment is what makes it believable. Here, IFC elements land within 0.1–0.4 m of the OpenStreetMap features they model, and data points sit exactly where the basemap draws them.
- The whole demo is one JSON scene file. Copy it, change the models and bindings, and you have your own.
Try it: Plaça de Catalunya, live
Opens the eight models on the ICGC terrain with the four live layers. The Bicing docks and the Endolla bays take their colour from the feeds, with the live value floating above them.
Open the interactive IFC viewer
What is in the scene
Eight georeferenced IFC 4.3 models around the square and the bottom of Passeig de Gràcia, on the Catalan cartographic institute's 5 m terrain, with the OpenStreetMap city around them.
| Model | What it is |
|---|
| Mobility hub | Bicing station 65 with its 21 docks, a bus shelter, the metro access with its lift, street furniture |
| Fonts Bessones | The twin fountains of the square, with their hydraulic and lighting systems |
| Macià monument | The monument to Francesc Macià, as a heritage asset |
| Pelai entrance | The Pelai entrance to Catalunya station |
| Canaletes | The top of La Rambla and the Canaletes fountain |
| Gran Via fountain | The monumental fountain at Passeig de Gràcia and Gran Via |
| Bench-lamps | Pere Falqués' bench-lamps on Passeig de Gràcia |
| Endolla charger | An on-street EV charging point: the charger, its connectors and two bays |
The models are illustrative reconstructions authored from public sources. Their asset data is labelled as demo values in the files. Bicing station 65: the dock posts take the station's state every minute, and the floating number is the bikes available right now.
Four open feeds and no server in between
| Feed | Publisher | Format | Refresh in the scene |
|---|
| Bicing stations | Bicing, Ajuntament de Barcelona | GBFS 3.0 | Map layer every 30 s; dock colours every 60 s |
| EV charging | Endolla / B:SM, Open Data BCN | GELFS JSON | Charger state every 5 min |
| Street traffic | Ajuntament de Barcelona, Open Data BCN | Status table joined to street sections | Every 5 min |
| Air quality | Agència de Salut Pública de Barcelona | Hourly CSV joined to the stations | Hourly, published 45 min to 3 h late |
Every request goes from the visitor's browser to the publisher. That only works because these feeds send the CORS headers that allow it, which was checked for each one before it went into the scene. The formats are open standards or plain files: GBFS for bike share[gbfs], a JSON file for Endolla, and CSV tables from the city's open-data portal[opendata-bcn]. All four are read in the browser.
From a feed to a coloured dock post
Colouring the docks of station 65 takes five steps, and the scene file holds every one of them:
- A device source The Bicing station-status feed, polled every 60 s. Each station in it becomes a device, keyed by station_id.
- One device Station 65, the one at the corner of the square and Passeig de Gràcia.
- A query for the elements IfcBuildingElementProxy elements whose name contains "ancoratge" (Catalan for dock), parts of assemblies included. That finds all 21 dock posts.
Assemblies matter here. The docks are parts of the station assembly (IfcRelAggregates), and a query that only looked at top-level elements found none of them.
- Rules, first match wins Out of service: grey. No bikes: red, with an alert after 15 minutes. Full: blue. Two bikes or fewer: amber. Otherwise green.
- A floating value and a staleness limit The number of available bikes floats above the docks. A reading older than the source allows turns them grey: "no recent data" never passes for "all is well".
{
  "sourceId": "bicing-status",
  "deviceId": "65",
  "query": { "classes": ["IfcBuildingElementProxy"], "nameContains": "ancoratge" },
  "rules": [
    { "name": "No bikes", "filters": [{ "field": "num_vehicles_available", "op": "eq", "value": 0 }],
      "effect": { "color": "#ef4444" }, "alert": { "forMin": 15 } }
  ]
}
 Click a dock post and its card shows station 65 live, next to the IFC data of the element.
The Endolla charger works the same way: its two bays take the state of charging location 3762 at Passeig de Gràcia 5. The charger's ids in the IFC are illustrative, so that binding is matched by position (the real location next to the model) rather than by a real equipment id.
Standing in the right place
A twin that floats a few metres off its street stops being convincing at the first glance. Each model here is placed by its own georeference, an IfcMapConversion in ETRS89 / UTM 31N, onto the terrain model[icgc-met]. Models that share an origin stay together. If your own models land in the wrong place, the usual causes are covered in IFC coordinates and georeferencing.
We measured where the models land against the OpenStreetMap features they represent, with both projected exactly as the basemap draws them:
IFC element vs the OSM feature it models
- Canaletes fountain column: 0.08m
- Fonts Bessones: 0.1m
- Macià monument: 0.3m
- Pelai glass kiosk: 0.38m
Measured in the running viewer on 2026-10-10. The data layers are exact: 687 points, up to 8 km from the square, sit 0.00 mm from where the map draws them.
Two details make the difference at this scale. The georeference stores its rotation from grid north, while the map is drawn to true north. In Barcelona the two differ by 0.55°, about a metre at the end of a 100 m model, and the viewer takes the difference out. And the data layers are projected exactly as the basemap projects, so a Bicing station 4 km away still sits on its pavement.
What it is not
- Not a control system. The data is what the publishers publish, at their pace: air quality is 45 minutes to 3 hours behind, and the EV file only says when a port last changed, not when it last reported.
- Not the city's asset register. The models are reconstructions and their maintenance data is illustrative.
- Not fast on every feed. Open Data BCN can take 15–40 s to answer, so traffic and charging can appear after the rest.
- Not measured on phones yet. The full scene, with eight models, four layers and the 3D city, has been tested on desktop browsers.
Build your own
The demo is one JSON file, a scene, which lists the models, the layers, the device sources, the bindings and the camera. To make your own:
- Copy the scene file Start from /scenes/barcelona-placa-catalunya.scene.json on this site.
- Swap the models Point the model URLs at your IFC files, on any host that sends CORS headers.
- Point the bindings at your elements Use an IFC class and part of a name, or a list of GlobalIds.
- Host it and open it Any static host will do. Open the viewer with ?scene= and the file's URL, or skip hosting: Share → Digital-twin scene packs the whole scene into the link itself.
<iframe
  src="https://www.ifcvieweronline.eu/?scene=/scenes/barcelona-placa-catalunya.scene.json&embed=1"
  width="100%" height="600" style="border:0;border-radius:12px"
  loading="lazy" allow="fullscreen"
  title="Plaça de Catalunya — open-data digital twin">
</iframe>
The same embed works on a project website, an intranet page or a CDE panel. The full set of parameters is in how to embed an IFC viewer. The same approach with other data is in live buses on an IFC bus terminal over MQTT and Tokyo station twins from ODPT data.
A Live Digital Twin of Plaça de Catalunya, Built From Open Data in the Browser