Back to the BIM & IFC blog
Tools & comparisons · 2026-10-27 · 8 min
Critical Rainfall for Landslides From a DEM and a KMZ, in the Browser
How much rain does it take for a slope above a school to fail? From a terrain model and a KMZ of the study area, the browser computes runoff, the probability of shallow landslides and the likely path of a debris flow as a storm goes on, and gives every home, school, health centre and road its critical rainfall.
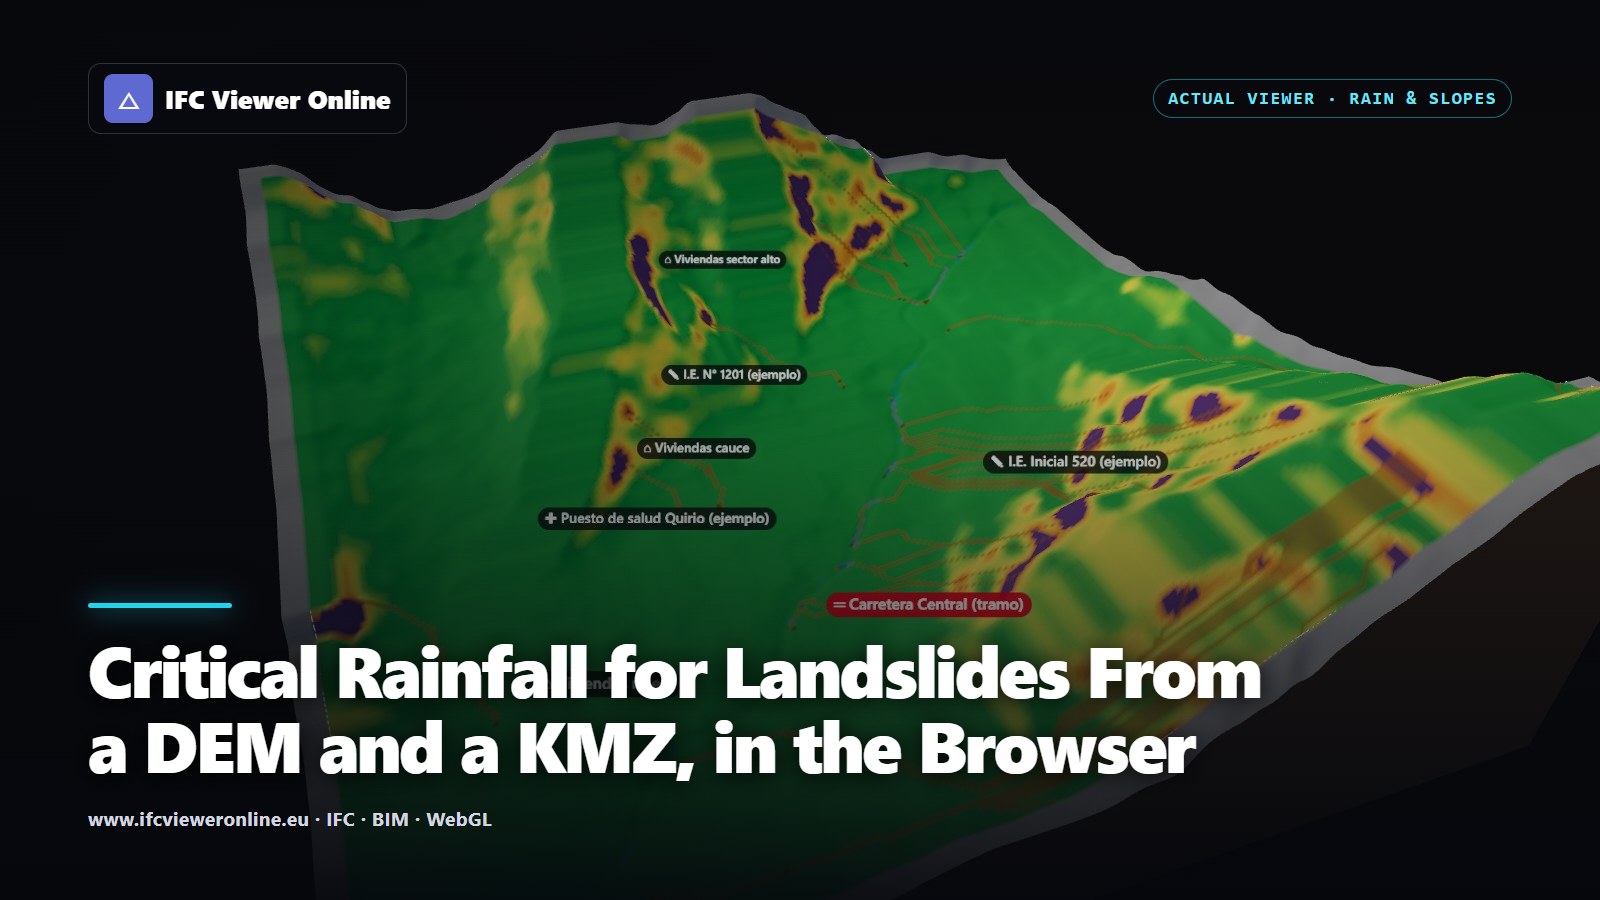 A 3D maquette of Quebrada Quirio in Chosica, Peru, cut out of the relief with earth walls: slopes coloured from green to dark red by landslide probability, water down the gullies in blue, and labels for the exposed homes, schools, health post and road
Where the rain comes down steep, bare slopes above a town, the hazard is not only the water. The ground itself gives way, and what starts as a small slide on a hillside can come down a gully as a debris flow and reach the houses at its mouth. Explaining that to the people who live there, and to whoever decides when to warn them, is hard with a static map.
This tool shows it as it happens. You give it the study area as a KMZ, it takes the terrain from the map, and it runs a storm step by step: how much of the rain runs off, which slopes become unstable as the soil soaks up the rest, where a debris flow from them would travel, and at what accumulated rain each home, school, health centre and road is first reached.
Key takeaways
- Runoff by the SCS curve number, slope failure by the infinite slope model with Monte Carlo, debris flow by a travel angle: standard, documented methods.
- Every exposed element in the KMZ gets a critical rainfall and the cause: landslide, debris flow or runoff. Exported as CSV and GeoJSON.
- Slopes that fail even without rain are shown apart: no rain threshold describes them.
- It runs in the browser in a few seconds and needs no IFC model. It is indicative: it does not replace an official risk assessment.
 Quebrada Quirio, Chosica, at the end of a 40 mm storm. The relief is real; the placemarks are made up for the example.
What goes in
- The study area as a KMZ or KML: one polygon for its boundary (named "study area", "boundary", "catchment"… or simply the largest one) and placemarks for what is exposed. Points, lines and polygons are read, in folders or not.
- The terrain, from the map's relief or from a DEM you import (GeoTIFF or ASCII grid). With no IFC model loaded, the KMZ itself places the scene, so the map opens on the study area.
- The storm, from the presets of the flood panel or drawn by hand as a hyetograph.
- The soil: hydrologic soil group, prior moisture, cohesion, friction angle, depth and unit weight, with editable defaults for residual soils on steep slopes.
Exposed elements are recognised by their folder, name, description or data: "vivienda", "I.E.", "colegio", "posta", "centro de salud", "carretera", "trocha" and their equivalents in other languages. A line with no name is taken as a road. With no KMZ, the schools, health centres, homes and named roads come from OpenStreetMap.
How it computes each step
| Step | Method | What it gives |
|---|
| Runoff | SCS curve number (TR-55), CN from OpenStreetMap land cover and the soil group | How much of the rain fallen so far runs off, and how much soaks in |
| Wetness | Infiltrated water over the soil's drainable porosity, more in hollows that collect water from upslope | The saturated fraction of the soil layer, cell by cell |
| Slope failure | Infinite slope factor of safety, 200 Monte Carlo samples of c′, φ′, γ and soil depth | The probability that the slope fails, P(FS < 1) |
| Debris flow | Steepest descent from the likely failures, stopped by a travel angle (12° by default) | Where the flows go and where they stop |
| Critical rainfall | The first step at which an element's cells fail, are crossed by debris or exceed a runoff depth | A rain threshold per element, with its cause |
The curve number gives the depth of runoff for the rain accumulated so far[tr55]. What does not run off enters the soil and raises its water table, faster in hollows that drain a large area above them. The infinite slope model then weighs the soil's strength against its weight on the slope, with the water reducing the friction[hammond]. Soil properties are never known exactly, so each is drawn 200 times around its value and the share of draws in which the slope fails is its probability.
Debris flows start where the rain made the slope fail and follow the steepest way down. They stop where the line from their source to their front becomes flatter than the travel angle: the empirical ratio of drop to distance that debris flows reach[corominas].
Watching the storm
The timeline replays the storm one step at a time. At the first millimetres only a few patches stand out; by the end of the storm the steep faces above the gully are orange and red, and the paths of the debris flows run from them to the valley floor. The labels of the exposed elements turn red at the step that reaches them.
 First step of the storm. Purple: ground that fails even without rain.
 After 250 mm accumulated. The labels turn red once the rain reaches their critical value.
Two more layers show the parts of the chain. Runoff colours the ground by how much has run off so far and makes the drainage network visible. Debris flow shows where flows from the likely failures travel (light brown) and stop (dark brown).
 Runoff at about 120 mm accumulated: the drainage network stands out.
 Debris-flow paths and deposits after the full rain tested.
Slopes that fail without rain
On the example, with the default soil, 13.6 ha fail before a drop has fallen: faces too steep for a soil of that strength, usually rock or a cliff in reality. The model cannot give them a critical rainfall, since no amount of rain is needed, and counting them would give every element below a cliff a threshold of nearly zero. They are shown in purple, set no threshold and start no debris flow, and an element standing on them is flagged. This is the "unconditionally unstable" class of SHALSTAB[shalstab]. Where they matter, the soil parameters should come from the field.
The critical-rainfall table
The table lists every exposed element, the most exposed first: the rain at which it is reached and by what. On the example, with the default parameters:
| Element | Critical rainfall | Cause |
|---|
| Carretera Central (stretch) | 1 mm | Debris flow |
| I.E. Inicial 520 | 7 mm | Landslide |
| I.E. N° 1201 | 70 mm | Landslide |
| Puesto de salud Quirio | 90 mm | Runoff |
| Homes (three groups) | 140 mm | Runoff |
A road reached at 1 mm is not a forecast that one millimetre will cut it: it says the cells the road crosses lie below slopes at the edge of equilibrium in this model, the most susceptible class. That is the value of the table: an order of what to watch first. Calibrated against past events and local soils, values like these are what early-warning thresholds are built from. The table exports as CSV and as GeoJSON, which opens in QGIS or Google Earth.
What it does not do
- It does not forecast rain or say when a slope will fail. It says how much rain each place can take under the parameters given.
- It uses one soil for the whole area, with uncertainty, not a geological map. Rock outcrops, colluvium and fill all look the same to it.
- Infiltration and groundwater are simplified: no lateral flow over time, no drainage between storms.
- Global relief (about 30 m) smooths small gullies and steep faces. A local DEM gives better slopes.
- It does not replace an official risk assessment, a field investigation, or an early-warning system's own calibration.
References
- Urban Hydrology for Small Watersheds (Technical Release 55) — USDA Natural Resources Conservation Service. The curve number method and its tables of CN by land cover and hydrologic soil group.
- Level I Stability Analysis (LISA) Documentation for Version 2.0 — Hammond, Hall, Miller & Swetik, USDA Forest Service. The infinite slope factor of safety with uncertain soil parameters, assessed by Monte Carlo.
- A physically based model for the topographic control on shallow landsliding — Montgomery & Dietrich, Water Resources Research 30(4). Critical rainfall from topography and the infinite slope; the "unconditionally unstable" class.
- The angle of reach as a mobility index for small and large landslides — Corominas, Canadian Geotechnical Journal 33(2). Travel angles (H/L) of debris flows and other landslides.
Critical Rainfall for Landslides From a DEM and a KMZ, in the Browser